
chat2csv: AI-Powered Data Visualization from Natural Language
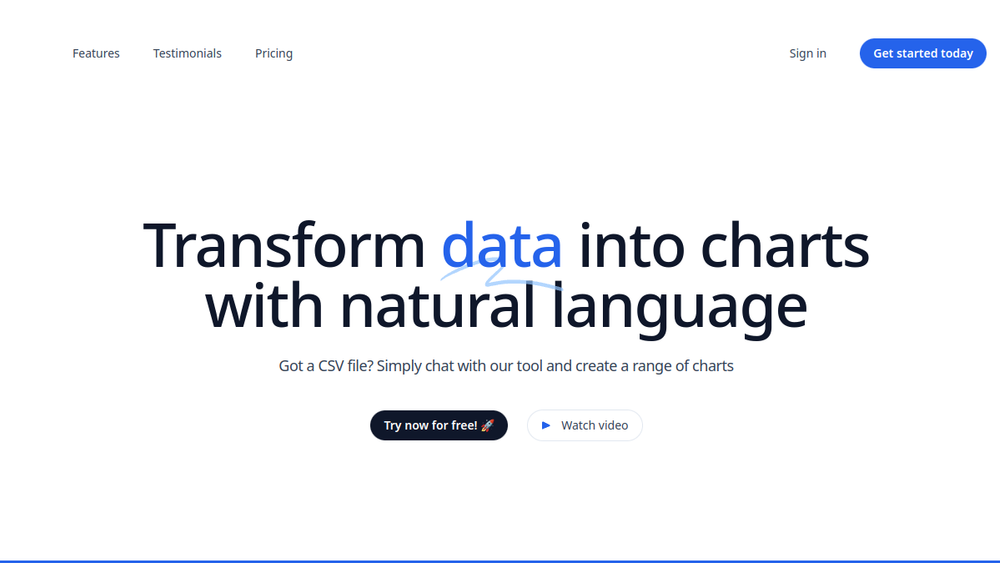
chat2csv is a web-based tool that enables users to create data visualizations from CSV files using simple, natural language instructions. It leverages AI to interpret user commands and generate appropriate charts without requiring coding or advanced technical skills.
Key Features
- Natural Language Interface: Users can describe desired charts in plain English (e.g., "Create a bar chart of sales by region"), eliminating the need for complex scripting or software proficiency.
- AI Chart Suggestions: The platform's AI analyzes uploaded data and recommends suitable chart types to best represent the information, enhancing analytical insights.
- Diverse Chart Types: Supports a wide range of visualizations, including line graphs, bar charts, pie charts, and scatter plots, catering to various data analysis needs.
- Privacy-Centric Design: Processes only necessary metadata on its servers. The actual CSV data remains on the user's local side, prioritizing data security and privacy.
- Free Tier Availability: Offers a free access plan with basic limits, allowing users to explore core functionalities at no initial cost.
Primary Use Cases
- Business Analytics: Quickly generate sales, performance, or financial reports from CSV data for business intelligence.
- Research & Academia: Visualize experimental results or survey data without investing time in learning specialized visualization software.
- Marketing & SEO: Analyze campaign performance metrics or keyword data trends through intuitive chart creation.
- Productivity & Automation: Streamline the reporting process by converting raw data files into visual insights through conversational commands.